Weregoose
20 Watchers95 Deviations
8.9K
Pageviews


Artleah21
teh-nice-guy
nomorelogo
WintersDawn
Zaphod-Beeble
Sylverone
LDS-Jedi
readerfreek
nihilena
Ruud-Fyre
fyrestarter67
cursethemountain
Watching 2
tifreak8x
AlienCC
Collection
Favourites
Collection Coming Soon!
Watch Weregoose to be the first to see new deviations.
Deviation Spotlight

- United States
- Deviant for 17 years
- He / Him
Badges
About Fyre
0 min read
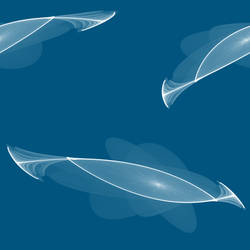
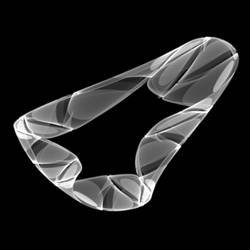
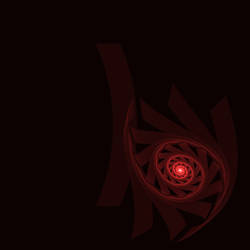
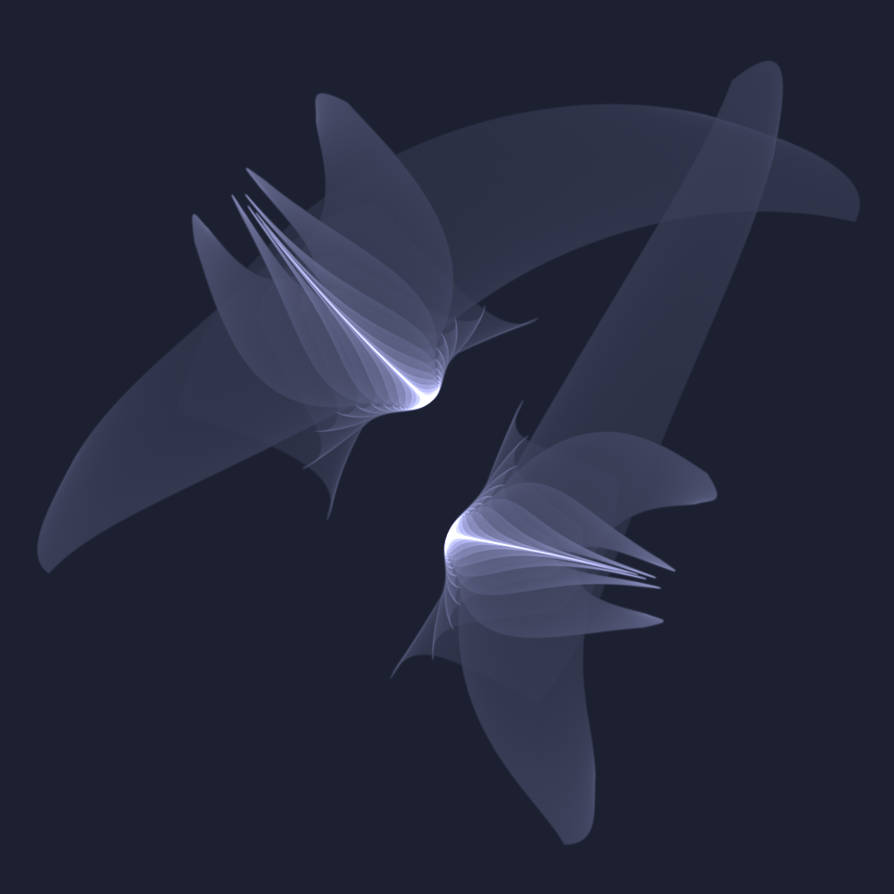
These are not fractals! Each image that you see is a map of the probability that a point (x,y) lies on the pixel canvas, and the points are calculated as follows:
x' = sin(a * y) - cos(b * x)
y' = sin(c * x) - cos(d * y)
These might best be referred to as Peter de Jong Attractors.
The program used to render these images is Fyre, written by Micah Dowty and David Trowbridge. It is open-source and available for use on many platforms. It can be found at navi.cx or by accessing this fyre.navi.cx.
If you have a picture that was made with the help of Fyre but isn't listed in my Favourites, then please send me a link so that I can include it for
Join the community to add your comment. Already a deviant? Log In
Profile Comments 73
Join the community to add your comment. Already a deviant? Log In
Hey a Fyre user! I just loaded Ubuntu Studio onto my spare hard drive yesterday and saw this program in there. Have been looking for more info on it all over the web, looks like some pretty cool stuff can be done. Any tips on where to start?
Thanks for collect 
Thanx for the  ! I love Fyre too!!
thanks for adding my pics to your fyre collection. looking through it, i found some new ideas ")
hi! thanks for adding and a question about your deviations. Do all they come straight from Fyre or do u use other software to edit them too?
I make them with Fyre, save, and then re-save with Irfanview to reduce the file sizes and strip parameters. There's no post-processing otherwise; all the images in my gallery are exactly as you would see them in the Fyre window.
Sweet! Your result are really beautiful!